English
0
My Cart
Shopping Cart
Your cart is currently empty


Artistic's House
A Lorenz curve, developed by American economist Max Lorenz in 1905, is a graphical representation of income inequality or wealth inequality. The graph plots percentiles of the population on the horizontal axis according to income or wealth and plots cumulative income or wealth on the vertical axis.
Subcategories
Showingof 2 item(s)

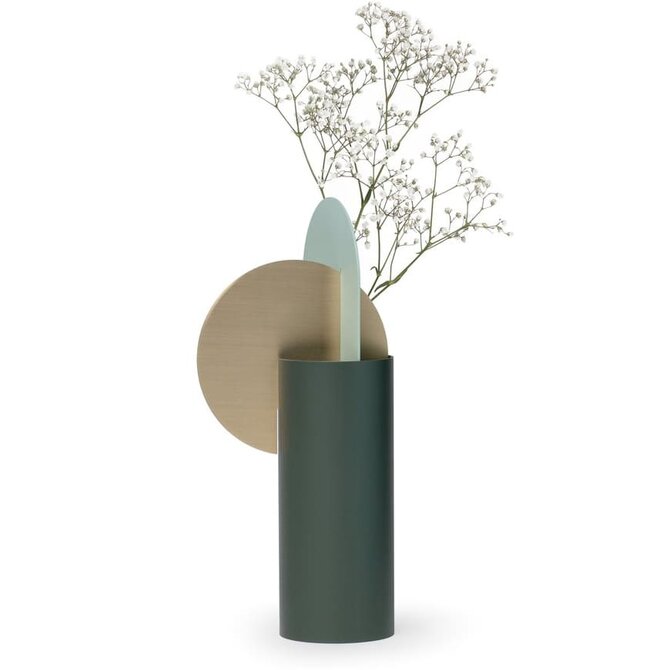
The Yermilov Vase by Noom is a masterpiece of contemporary design. Crafted with precision and innovation, this vase showcases a harmonious blend of form and function. Its distinctive silhouette and high-quality materials make it a standout decor piece tha
€150,00

Introducing the Art Deco Monumental Vase Bowl – a true statement piece that embodies the grandeur and elegance of the Art Deco era. This sizable vase bowl, with its intricate geometric patterns and bold design, serves as a captivating centerpiece for any
€120,00
Showingof 2 item(s)